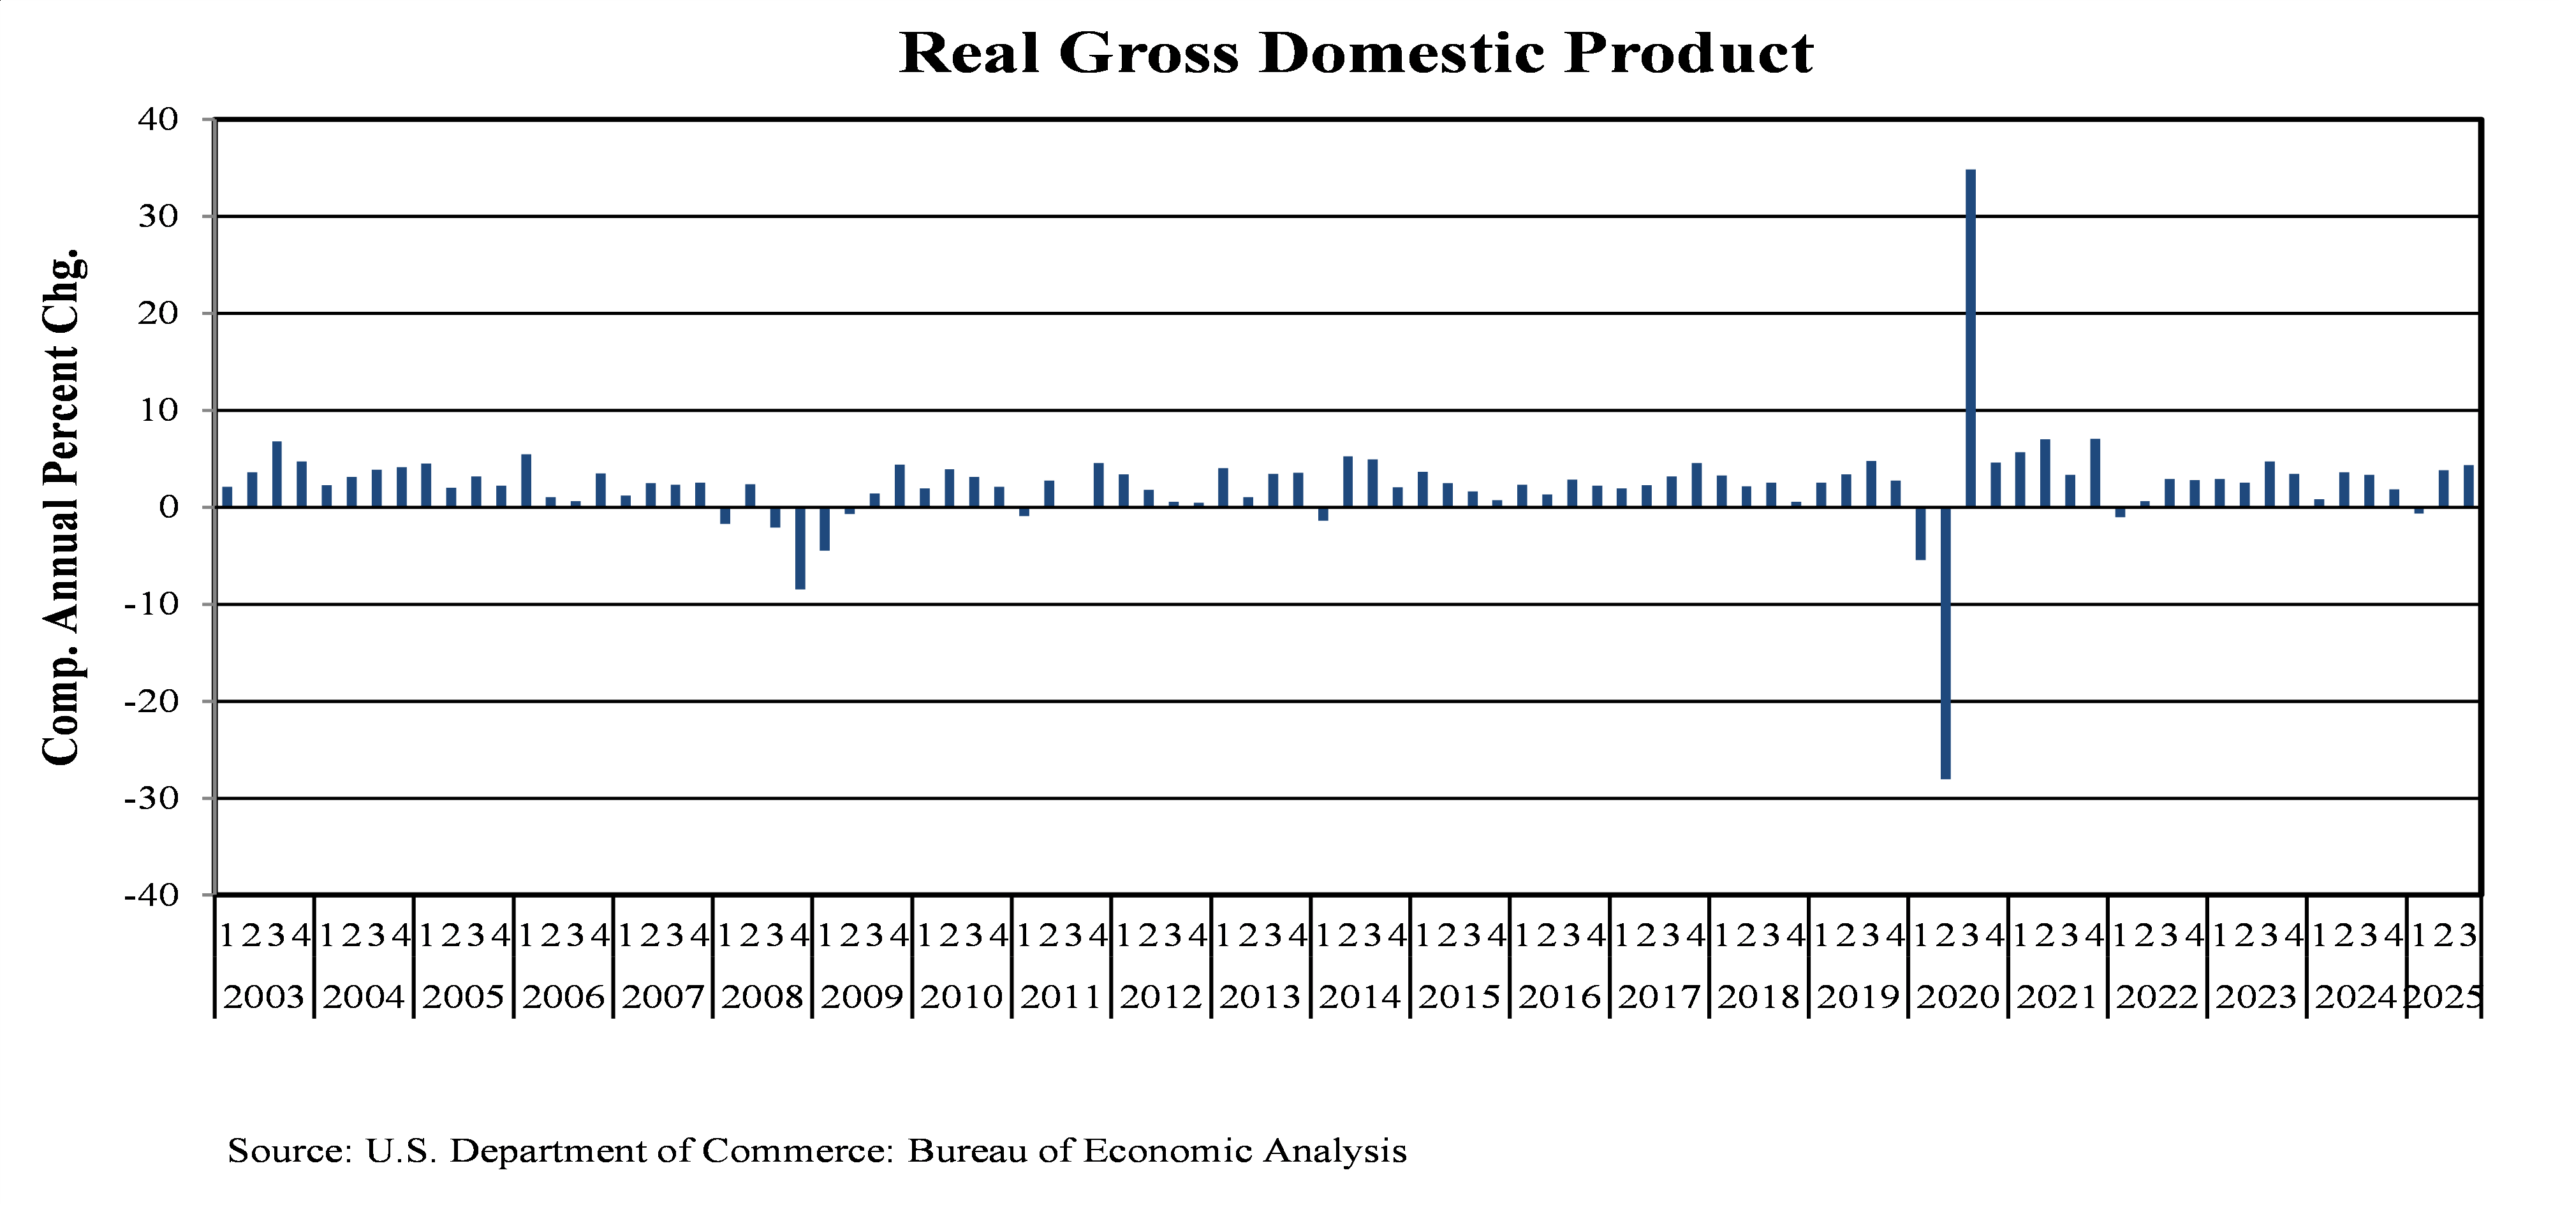
The year 2025 was good for both the economy and capital markets. Investment in Artificial Intelligence (AI), data centers, software, and R&D collectively proved to be a significant engine of economic growth and stock market returns. After contracting at a -0.5% annualized rate in the first quarter, mainly due to inventory distortions as firms rushed to fill warehouses ahead of pending tariffs, the economy rebounded decisively. Real Gross Domestic Product (GDP) growth accelerated to 3.8% and 4.3% in the second and third quarters, respectively, underscoring underlying momentum once trade-related noise faded.
That momentum was tested in early April. President Trump’s April 2nd Rose Garden announcement of a 10% baseline tariff on most imports, alongside much higher reciprocal tariffs aimed at dozens of trading partners, marked the most expansive tariff increase since the 1930’s. Equity markets reacted swiftly. The following day, the Standard & Poor’s 500 Index dropped 4.8%, while the Nasdaq fell 6.0%. Equity market weakness persisted in the days that followed, accompanied by rising long-term Treasury yields. On April 8th, the administration further raised tariffs on Chinese imports from 34% to 84%. The Standard & Poor’s 500 Index subsequently fell 19% from its February peak. The market swoon contributed to President Trump’s April 9th announcement of a 90-day pause on many reciprocal tariffs, igniting the third-biggest single-day gain in the Standard & Poor’s 500 Index since World War II.
Trade tensions eased meaningfully later in the spring. The U.S. stepped back from further escalation with China, and global retaliation proved more limited than initially feared, particularly across Europe. In addition, enforcement around Chinese re-exports proved less aggressive than expected, reducing the effective drag from tariffs. Trade data illustrate this adjustment: direct shipments from China to the U.S. declined sharply, while imports from other parts of Asia and Mexico rose in parallel. The pattern suggests rerouting goods to circumvent tariff barriers, rather than wholesale restructuring of global supply chains, helping explain why trade frictions did not derail economic momentum.
Domestically, recent retail spending has become increasingly concentrated among a small segment of consumers. The top 10% of earners now represent nearly half of total consumption, the highest share on record. While this concentration helped sustain headline demand, it also increased the economy’s reliance on wealth tied to rising asset values rather than broad-based growth in disposable income. Because wealth is primarily tied to housing, equities, and bonds, it is inherently more volatile, leaving spending patterns more exposed to shifts in financial markets.
These dynamics reflect the contours of the “K-shaped” economy. Higher-income households, occupying the upper arm of the “K”, continue to benefit from rising asset values and relatively stable employment, supporting aggregate discretionary spending. In contrast, most households remain on the lower arm, facing pressure from elevated inflation, higher housing costs, and slowing wage growth. This divergence helps explain why consumption has held up even as consumer confidence, as measured by the Conference Board, recently slid for a fifth consecutive month. This decline represents the longest streak of declines in consumer confidence since 2008.
Housing affordability underscores this divide. The median age of first-time home buyers reached a record 40 years old in 2025, while the median age for repeat home buyers is now 61. Elevated home prices, higher mortgage rates, and limited inventory raised the barriers to entry, leaving first-time buyers at a historically small share of the market. As a result, housing wealth continues to accrue disproportionately to existing owners, reinforcing wealth disparities.
Strong enthusiasm for Artificial Intelligence (AI), easing inflation pressures, and increasingly accommodative monetary policy helped to drive both equity and bond markets higher. What set 2025 apart was not simply the strength of returns but their breadth. Gains were unusually synchronized across equities, fixed income, credit, and real assets. Markets have not witnessed such cross-asset performance since 2009, when markets recovered from the Great Financial Crisis. By year-end, financial conditions had eased materially, and valuations had expanded, but investor expectations converged around a narrow set of themes.
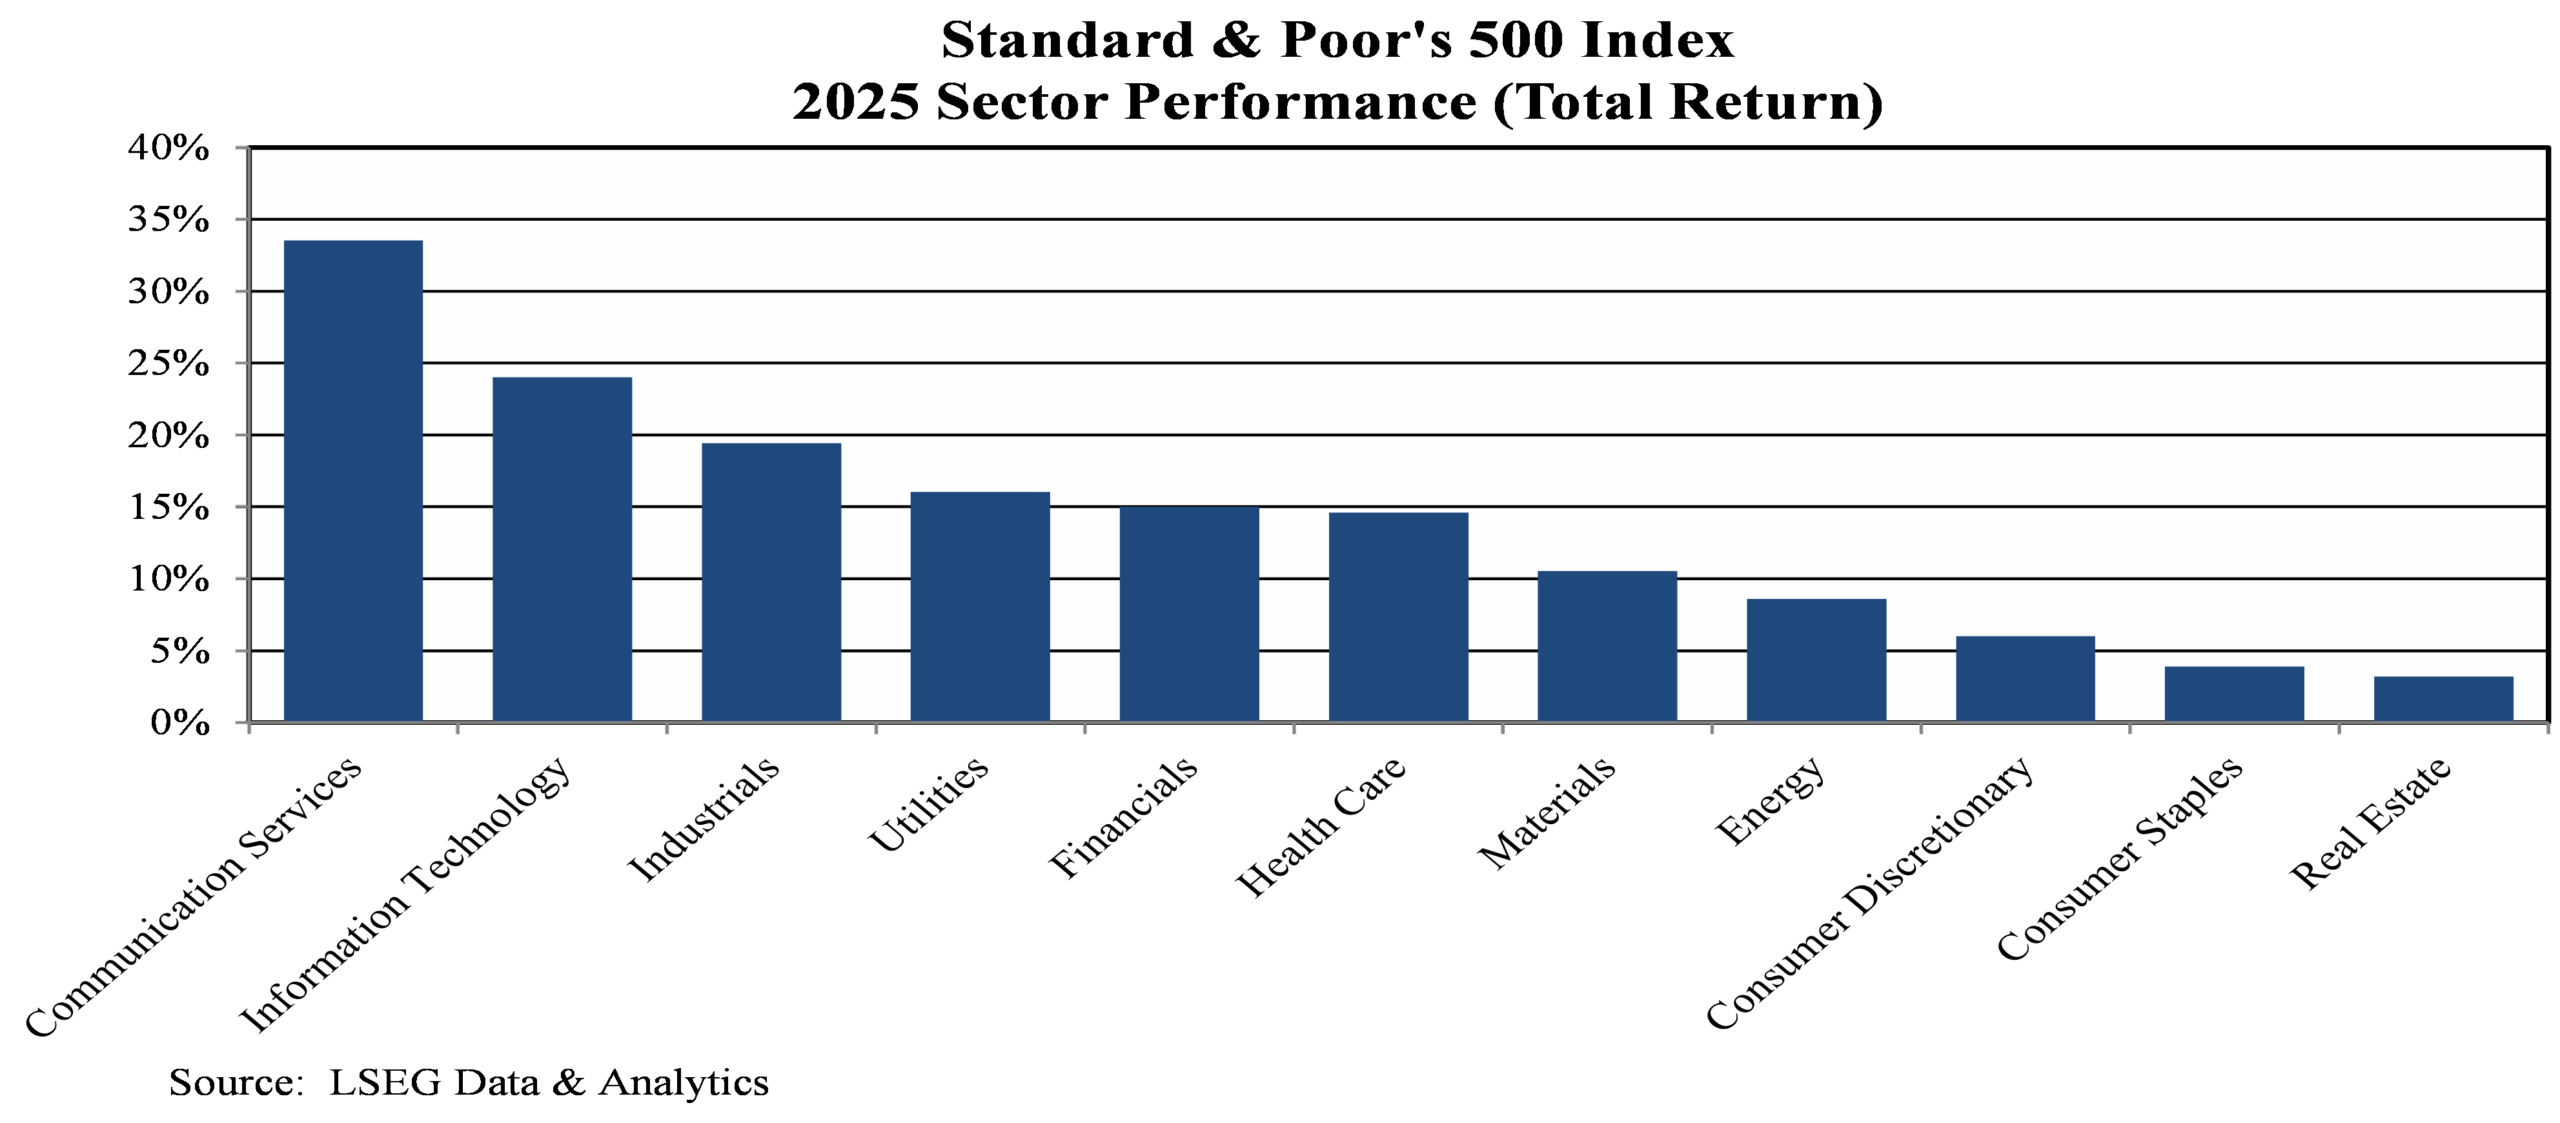
Despite strong headlines and returns, equity market leadership remained narrow. By November, the ten most valuable companies in the Standard & Poor’s 500 Index accounted for 42% of the index’s market capitalization. The top ten performing stocks generated 55% of the index’s 17.9% total return for the year, with only two of those companies not technology-related. Just 31% of the Standard & Poor’s 500 Index constituents outperformed the benchmark – one of the lowest readings in four decades, comparable to 1999 and 2024. We expect market leadership to broaden in the year ahead as earnings growth between AI-linked firms and the broader market converges. Ultimately, the economic return on AI investment must begin to accrue in sectors outside of technology to justify the magnitude of the investment.
As in prior fourth-quarter reviews, we have included a compendium of economic and market-related charts.
LOOKING AHEAD TO 2026
AI-related capital spending will remain a defining theme in 2026. Capital expenditures by Microsoft, Alphabet, Amazon, and Meta have risen nearly 200% over the past four years to almost $400 billion in 2025. We estimate the combined capital outlays for these four “hyperscalers” could exceed $465 billion in 2026. GDP categories related to AI investment may account for as much as half of total economic growth in the coming year. During the first three quarters of 2025, this portion of GDP accounted for 37% of real GDP growth, though that figure may be understated due to incomplete data resulting from the government shutdown.
A key feature of this investment cycle relative to earlier episodes in U.S. history is how it is being financed. Previous infrastructure booms typically exceeded firms’ internal resources, forcing heavy reliance on debt markets. The current hyperscaler buildout is notably different. A small group of mega-cap companies is generating substantial operating cash flow, allowing them to fund a significant portion of the capex surge internally. That said, as cash outlays for construction and infrastructure rise above 65-70% of operating cash flow, we expect these firms to incorporate more debt into their capital structures. Recent issuance activity, such as Meta’s $30 billion debt offering and Alphabet’s $25 billion issuance, provides early evidence of this shift. Importantly, these companies retain ample balance sheet capacity to support incremental leverage.
As funding sources tilt more toward debt, we expect greater scrutiny of returns on investment. Yet estimating those returns remains challenging, as the monetization model for AI is still evolving. Revenue may ultimately be generated through a mix of consumer subscriptions, enterprise licensing of large language models, revenue-sharing from agentic commerce, and digital advertising. The most likely outcome is a hybrid model rather than reliance on any single channel.
Looking ahead into 2026, leadership at the Federal Reserve is set to change, as Jerome Powell’s term as Chairman expires on May 15th. President Trump has been explicit in his preference for lower interest rates, a stance that is likely to influence his nomination of the next Chair early in the year. This leadership transition comes at a time when the Federal Reserve casts an even larger shadow over the economy, given its active balance sheet management alongside its policy rate. In late 2025, the Federal Reserve pivoted away from quantitative tightening and resumed balance sheet expansion, effectively restarting quantitative easing. Combined with recent interest rate cuts and Treasury bill purchases, monetary policy is poised to remain accommodative in the new year. Historically, both equity and bond markets tend to perform well during non-recessionary rate-cutting cycles – such as 1989, 1984, 1995, 2019 – compared with cycles associated with economic downturns, including 2001 and 2007.
In addition, 2026 will mark the second year of the presidential cycle, which has historically been the best year for economic growth and the weakest for equity market gains. The administration is expected to rely heavily on $150 billion in tax refunds for individuals, $200 billion in business tax cuts, and interest rate policy pressure to build economic momentum ahead of the midterm elections. Additional fiscal measures, including tariff-related rebate checks, are possible.
Midterms have traditionally functioned as a referendum on the sitting president, reflecting voter sentiment around economic conditions, political stability, and perceptions of balance in Washington. These dynamics are primarily structural rather than partisan, embedded within our political system. Since World War II, the president’s party has lost seats in the House of Representatives in 18 out of the past 20 midterm elections, with the only exceptions occurring in 1998 under Bill Clinton and 2002 under George W. Bush.
Recent Democratic victories in California, New York, New Jersey, and Virginia suggest that long-standing midterm election patterns are likely to remain intact. Voter dissatisfaction with the cost of living appears to have played a meaningful role. This creates a challenging backdrop for Republicans, as expansive fiscal policy combined with accommodative monetary conditions risks keeping inflation elevated. Elevated inflation could continue to put upward pressure on longer-term interest rates. Mortgage rates, in particular, remain a key sensitivity. We previously wrote about how the yield on the 10-Year Treasury rose by roughly 1% in 2024, even as the Federal Reserve reduced its policy rate by the same amount. The long end of the yield curve has thus far shown limited responsiveness to easing, suggesting mortgage rates may remain elevated, to the ire of the administration.
Beyond 2026, the policy mix raises more fundamental concerns. A combination of fiscal transfers, tax relief, and lower interest rates risks delivering short-term momentum at the expense of higher inflation. The pandemic period underscores how quickly aggressive stimulus can translate into renewed inflation. If that were to occur, the burden would fall most heavily on households, and restoring the Federal Reserve’s credibility could take several years. Fiscal sustainability remains an ongoing challenge, with deficits near 6% of GDP projected to persist. With a steep yield curve, the Treasury has shifted issuance toward shorter maturities to contain interest costs, further intertwining fiscal and monetary policy and increasing the economic pain of future inflation-fighting efforts.
AI-driven productivity, trade policy, credit spreads, fiscal tightening, and immigration dynamics will continue to shape the economy and market outlook. While economic activity remains resilient, it has become increasingly reliant on affluent consumers and AI-fueled capital investment. As a result, the K-shaped economy is likely a temporary equilibrium because it relies on sustained strength within a small cohort with limited benefits currently shared across broader demographics and industry. Over time, it becomes more fragile, as even modest shocks to asset prices or confidence can have outsized macroeconomic effects.
AI-related investment continues to turbocharge headline economic growth, but it also introduces new risks. A deceleration in spending could weigh materially on the economy, potentially triggering a market downturn, or at a minimum, eroding the wealth effects that have supported consumption. Corporate management teams across industries face mounting pressure to integrate AI into their operations, with reputational risk skewed towards underinvestment rather than excess. As AI infrastructure costs rise, firms may increasingly reallocate budgets to fund AI priorities, leading to hiring freezes, workforce reductions, or limited capital investments outside of core technology areas, reinforcing downside pressure on labor markets even as AI investment remains elevated.
Finally, while the market and economy enter the new year with considerable tailwinds, valuations already reflect much of this optimism. The Standard & Poor’s 500 Index Price/Earnings multiple now sits in the 95th percentile of its 35-year range. Other long-term measures, including total U.S. equity market capitalization relative to GDP, stand at their highest levels since 1950. Warren Buffett, who stepped down as CEO of Berkshire Hathaway at year’s end, often wrote about this ratio. While we expect equities to deliver positive returns supported by strong corporate earnings growth, we also anticipate a more volatile environment than investors generally experienced over the prior three years, heightened by continued policy uncertainty.
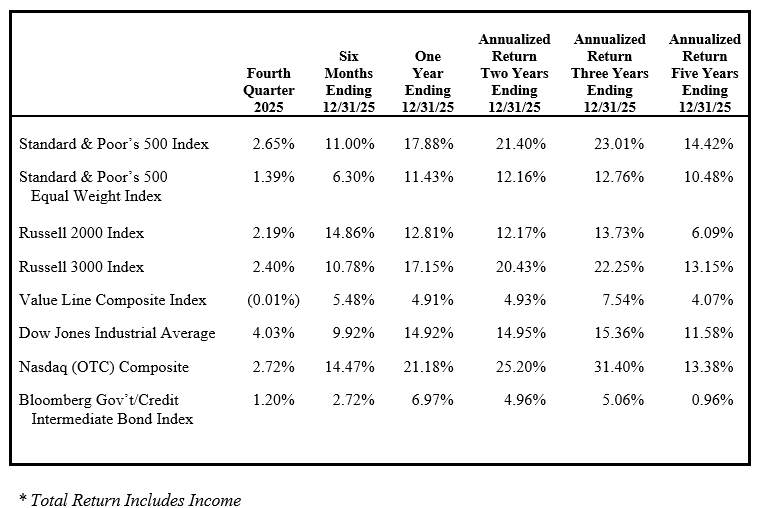
FINANCIAL MARKET TOTAL RETURN*
Michael C. Yeager, CFA
January 6, 2026
IMPORTANT INFORMATION
The commentary set forth herein represents the views of Luther King Capital Management and its investment professionals at the time indicated and is subject to change without notice. The commentary set forth herein was prepared by Luther King Capital Management based upon information that it believes to be reliable. Luther King Capital Management expressly disclaims any responsibility to update the commentary set forth herein for any events occurring after the date indicated herein or otherwise.
The commentary and other information set forth herein do not constitute an offer to sell, a solicitation to buy, or a recommendation for any security, nor do they constitute investment advice or an offer to provide investment advisory or other services by Luther King Capital Management. The commentary and other information contained herein shall not be construed as financial or investment advice on any matter set forth herein, and Luther King Capital Management expressly disclaims all liability in respect of any actions taken based on the commentary and information set forth herein.