At the end of last year, the U.S. economy appeared strong – Gross Domestic Product was expanding at nearly 3%, unemployment remained low, the Federal Reserve had recently reduced interest rates by 1%, and the equity market was reaching new highs. Optimism was high that newly elected President Trump would stimulate economic growth through deregulation and substantial tax reform. One notable initiative was a proposal to lower the corporate tax rate to 15%, contributing to a surge in business confidence, and manufacturing output even turned positive after a prolonged slump.
However, the administration’s early priorities shifted toward curbing immigration, starting deportations, and dramatically cutting government programs and employees. These moves now weigh on consumer and business confidence, suggesting that weaker economic growth and potentially higher inflation may lie ahead. The March Federal Reserve meeting’s output revealed that the central bank holds a similar view on decelerating economic growth while forecasting rising unemployment.
Financial markets have had difficulty accurately reflecting where the economy is headed in the current business cycle. The alignment of several economic indicators in 2023 suggested that a recession was likely, yet the consumer proved more resilient than expected to monetary tightening. Today, the fear of stagflation is emerging amid signs of slowing growth, concerns about a tariff-induced inflation surge, and the Federal Reserve’s forecast of rising unemployment.
Slowing economic growth and rising inflation, the definition of stagflation, is not a natural state for the U.S. economy. In most economic cycles, periods of high inflation are accompanied by strong growth, and recessions tend to bring lower inflation due to reduced demand. When stagflation occurs, as it did in the late 1960s and early 1970s, it is often the result of an economic shock, such as rising oil prices, or policy errors, including overly loose monetary policy. Since then, policymakers have sought to avoid similar scenarios by striking a balance between inflation and economic growth. However, recent concerns about post-pandemic supply chain constraints, high levels of fiscal debt, and persistent inflation have renewed fears that elements for stagflation are more prevalent than ever since the late 1960s. The catalyst, or economic shock, for stagflation may be tariffs.
Elevated policy uncertainty contributed to a 4.3% decline in the Standard & Poor’s 500 Index in the first quarter. At the same time, the yield on the 10-Year Treasury note remained relatively stable, closing the quarter at 4.54%.
ECONOMY
The U.S. has maintained some of the lowest tariffs and trade barriers globally since the General Agreement on Tariffs and Trade (GATT) of 1947. According to recent data, the average applied tariff rate in the U.S. is approximately 2.3%, significantly lower than the global average of over 5%. Non-tariff barriers, such as quotas and licensing requirements, are also relatively limited compared to other major economies. President Trump has consistently advocated for the use of tariffs as a tool to protect American industries and reduce trade deficits. As President Trump stated in his first term, “I am a Tariff Man. When people or countries come in to raid the great wealth of our Nation, I want them to pay for the privilege of doing so. It will always be the best way to max out our economic power.” The Trump administration argues that tariffs help level the playing field, bring back manufacturing jobs, lower the budget deficit, and pressure other countries to negotiate on items such as drug trafficking and defense spending. This stance reflects a broader shift toward economic nationalism, where fairness is measured by market openness and perceived reciprocity and benefits to American workers.
The impact of tariffs on the price of goods is complicated. In the classic sense, tariffs are noninflationary because they do not set in motion sustained upward pressure on prices. Instead, tariffs represent a one-time step-function change in the price of imported goods. Although not classically inflationary, tariffs have a clear cost. They have the same effect as a price increase stemming from any other cause. Calculating the impact of tariffs on prices is a complex task because it depends on the elasticity of demand for the product. For example, medical equipment demand is less dependent on pricing than demand for luxury goods. The impact of tariffs on business also depends on the gross margin, or the cushion a company has to absorb additional costs, such as tariffs. Once in place, tariffs are generally either fully passed through to selling prices or absorbed by importers’ margins, or, typically, a combination of both.
During President Trump’s first term, Michigan-based Whirlpool argued that foreign competitors, notably Samsung and LG, were flooding the American market with cheaper washing machines, harming the demand for domestic supply. In response, the administration implemented a 20% tariff on the first 1.2 million imported washers, which increased to 50% thereafter. In response, washing machine prices jumped 12%. What is more interesting is that the cost of dryers, which were not subject to tariffs, also increased. Because washing machines and dryers are often purchased as complementary products, retailers tend to price them similarly. Companies absorbed a slightly lower margin on washing machines but achieved higher margins on dryers. It is also worth noting that domestic suppliers, including Whirlpool, Maytag, and GE, raised their prices despite not being subject to tariffs.
Tariffs are rising by executive order at a time when consumers are particularly sensitive to prices, having just endured the highest inflation in four decades. The uptick in consumer inflation expectations reflects this sensitivity. Throughout the recent bout of inflation, the Federal Reserve has emphasized the importance of stable inflation expectations, and, to date, those expectations have remained well anchored, which has helped ease policy challenges. Alternatively, suppose households and businesses start to believe that prices will continue to rise and adjust their behavior to reinforce inflation, such as demanding wage increases or preemptively raising prices. This feedback loop can make it harder to rein in inflation. For instance, the University of Michigan’s one-year inflation expectation has just climbed to 5%, the highest level since November 2022, while long-term expectations have reached their highest level since 1993.
The summary of the Federal Reserve’s March meeting suggests that the central bank has limited visibility of the near-term direction of the economy. The central bank projected much slower economic growth, higher unemployment, and higher inflation than it did three months ago. This negative outlook increases the likelihood of a recession, which typically occurs when an economy becomes vulnerable to a downturn and is then struck by an economic shock. You could quickly build a case that the economy has become more vulnerable over the past several months as pandemic-era savings have been depleted and job openings for workers seeking employment are less abundant, for example. In addition, government spending may be in retreat. The question is whether or not tariff-induced economic uncertainty is the catalyst that precipitates a recession.
MARKETS
The first quarter of 2025 delivered a turbulent ride for equity investors, primarily fueled by fluctuating tariff headlines. Following Election Day, the Standard & Poor’s 500 Index surged 6.7% to a record high on February 19th as markets responded positively to scaled-back tariff rhetoric and a business-friendly policy outlook. However, momentum shifted sharply in the latter half of the quarter as renewed uncertainty around trade measures and broader policy direction began to shake business and consumer confidence. The index retreated 10% from its peak, ending the quarter down 4.3%, with March alone seeing a decline of 5.6%. Leading the downturn were the same mega-cap technology giants – Alphabet, Amazon, Apple, Meta, Microsoft, Nvidia, and Tesla – that powered much of the index in 2024. This group of stocks, known as the Magnificent Seven, fell 16.0% during the first quarter.
On April 2nd, “Liberation Day,” President Trump raised the weighted average tariff rate on imports from 2.5% at the start of the year to 24%, levels not seen since the 1930s. The breadth of targeted countries and the steepness of the “reciprocal” tariffs were more aggressive than markets anticipated. While there is room for negotiation and possible moderation of country-specific tariffs, the 10% across-the-board measure reflects the administration’s genuine desire to reshape the world trade order.
In response, the equity market abruptly repriced global growth expectations, with the Standard & Poor’s 500 Index falling 10.5% in two days. It was only the fourth time the market had experienced a two-day decline of 10% or greater since World War II. Markets also priced in increased odds of interest rate cuts and a sharp rise in inflation. Stagflation, as described earlier, presents the most challenging environment for central bankers, placing the Federal Reserve’s dual mandate of price stability and full employment at odds. If unemployment rises sharply, will the Federal Reserve choose to cut interest rates, given that inflation expectations may be biased higher? Despite President Trump’s urging that the Federal Reserve cut interest rates, we would not be surprised to see the central bank react slowly to deteriorating economic data if inflation remains sticky and tariffs remain on the horizon.
Significant tariffs were announced when the equity market valuation was high by historical standards. The consensus forecast for corporate earnings growth for 2025 was 12% before the start of the year. The Standard & Poor’s 500 Index entered the year trading at 21.5 times earnings. As confirmed by our conversations with corporate management teams, the visibility of corporate earnings growth has become exceedingly unclear. If the current slate of tariffs remains in place for at least two quarters, the economy will likely experience a shallow recession. Under that scenario, the market would experience more downside, in our view. This is quite a remarkable change in the outlook for an economy in good health less than 100 days ago.
CONCLUSION
The critical issue for the economy and the markets is the timing and opportunity set for tariff “off-ramps.” Several countries, including the U.K., Switzerland, and South Korea, have indicated they do not intend to retaliate. Vietnam already signaled its willingness to lower its tariff schedule for the U.S. in return for similar treatment. The Trump administration will likely face legal, business, political, and market pressure to negotiate.
The lesson from Trump’s first administration was to take him seriously but not literally. Within this context, the market made three key assumptions. First, Trump uses the equity market as a barometer of his economic policy; he would not want to tank the market deliberately. Second, tariffs were simply the “stick” to bring parties to the negotiation table. Third, it would be unprecedented for an administration to intentionally put the economy into recession. All three of these premises are now in doubt. The market’s new working assumption is that Trump believes the U.S. is economically disadvantaged (clearly, some tariffs placed on the U.S. are less than fair – but the extent to which this is widespread is a matter of great debate), and using country trade surpluses is a problematic parameter. Tariffs, therefore, reflect Trump’s core ideology more than a negotiating tool. This led to the market’s 10.5% correction in two days in April.
Vietnam, where over half of Nike’s and Adidas’ footwear is manufactured, immediately contacted the Trump White House with an offer to lower its tariffs on the U.S. to zero. On the other hand, China retaliated with its 34% tariff on the U.S. What would help the market considerably would be a demonstrated “off-ramp.” For example, the administration moves VERY quickly to remove tariffs on Vietnam while publicly acknowledging productive talks with China. Other large trading partners, such as the E.U., have thus far remained silent. They are likely looking for the same signal that the market seeks regarding the availability of off-ramps.
Market volatility will likely remain elevated as trade policy continues to be negotiated globally in real time. Regardless of the result of tariffs, the administration will soon likely pivot to discussing the permanent extension of the expiring Tax Cuts and Jobs Act and controversial tax breaks on tips, overtime pay, and Social Security benefits. In these uncertain times, we remain focused, as always, on owning what we believe are high-quality businesses with strong balance sheets and cash flows, with smart management that can adapt to the fast-changing landscape.
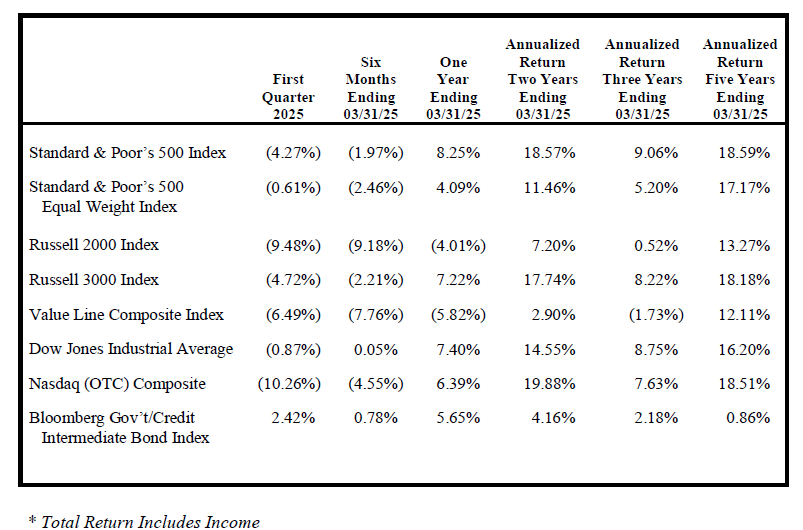
FINANCIAL MARKET TOTAL RETURN*
Michael C. Yeager, CFA
April 5, 2025
IMPORTANT INFORMATION
The commentary set forth herein represents the views of Luther King Capital Management and its investment professionals at the time indicated and is subject to change without notice. The commentary set forth herein was prepared by Luther King Capital Management based upon information that it believes to be reliable. Luther King Capital Management expressly disclaims any responsibility to update the commentary set forth herein for any events occurring after the date indicated herein or otherwise.
The commentary and other information set forth herein do not constitute an offer to sell, a solicitation to buy, or a recommendation for any security, nor do they constitute investment advice or an offer to provide investment advisory or other services by Luther King Capital Management. The commentary and other information contained herein shall not be construed as financial or investment advice on any matter set forth herein, and Luther King Capital Management expressly disclaims all liability in respect of any actions taken based on the commentary and information set forth herein.