Artificial intelligence remains the defining investment in the economy. Business spending on equipment increased 15.8% during the first quarter from a year earlier, led by information processing equipment, while investment in intellectual property products (primarily software) rose 13.8%. Data center construction continued to accelerate, increasing more than 22% on an annualized basis. Taken together, investment in AI-related equipment, software, and infrastructure accounted for an estimated three-quarters of first-quarter Gross Domestic Product growth. That follows the final quarter of last year, when economic growth was just 0.5%, underscoring how important the AI investment cycle has become to the broader economy.
Large-scale capital investment expands productive capacity, supports employment, and creates demand across industries ranging from electrical equipment and construction to transportation and power generation. At the same time, it also leaves the economy increasingly dependent on continued business spending. Should hyperscalers or enterprise customers begin to moderate investment plans, the impact would likely extend well beyond the technology sector and become visible in overall economic growth. At this time, order books remain healthy, capital commitments continue, and the investment cycle appears intact.
The economy continues to benefit from resilient corporate earnings, healthy labor markets, and one of the strongest investment cycles in decades. At the same time, inflation remains above target, financial conditions have tightened, and equity markets have already discounted much of the favorable news. The next phase of this cycle will likely be determined less by whether AI transforms the economy and more by whether today’s extraordinary levels of capital spending and profit growth prove to be the beginning of a durable secular expansion or simply the peak of an unusually powerful investment cycle.
ECONOMY
The defining characteristic of this economic expansion has been its resilience. Despite relatively restrictive monetary policy, elevated geopolitical uncertainty, and inflation remaining above the Federal Reserve’s target, economic activity continues to exceed expectations. Real Gross Domestic Product expanded at a 2.1% annualized rate during the first quarter, payroll growth has strengthened, and business confidence has remained surprisingly firm. While the pace of growth has moderated from the extraordinary, fiscal-induced post-pandemic recovery, the economy continues to expand from an underlying position of strength.
What distinguishes the current cycle from most economic expansions is its source of growth. Previous expansions were often driven by housing, consumer borrowing, or easy financial conditions. Today’s economy is increasingly powered by business investment. Companies continue to commit extraordinary amounts of capital towards AI, manufacturing, reshoring, automation, and critical infrastructure. Those investments are supporting employment today while potentially expanding the economy’s productive capacity for years to come.
AI sits at the center of the current investment cycle. The unprecedented buildout of computing infrastructure has expanded well beyond semiconductor manufacturers and hyperscaler data centers. Demand is now spreading into electrical equipment, industrial automation, engineering, construction, power generation, and transportation. At the same time, companies continue to reshore production in strategically important industries, including semiconductors, pharmaceuticals, and defense. Combined with fiscal incentives that encourage domestic investment, these trends have produced one of the strongest capital spending environments in decades.
Inflation remains a challenge. Recent price pressures appear to reflect a combination of temporary supply-side forces rather than a broad resurgence in aggregate demand. Higher energy prices, tariff-related cost increases, and shortages associated with the rapid buildout of AI infrastructure have all contributed to firmer inflation readings. These influences have interrupted the disinflationary trend, but they are fundamentally different from the demand-driven inflation that typically requires a significantly more restrictive monetary policy response.
Despite inflation remaining above the Federal Reserve’s target, we continue to believe policymakers are more likely to maintain current interest rates than to tighten monetary policy. This view runs counter to consensus expectations. Higher interest rates cannot produce additional oil, eliminate tariffs, or accelerate the production of transformers, electrical equipment, or advanced semiconductors. As long as long-term inflation expectations remain well anchored and wage growth continues to moderate, policymakers can reasonably allow many of today’s supply constraints to dissipate over time. Housing inflation, the largest component of the Consumer Price Index, remains higher than private-sector rent measures, which have already cooled materially.
Financial conditions have tightened. For example, the yield on the 30-year Treasury Bond reached its highest level since 2007. Governments can sustain elevated debt burdens for extended periods and are not subject to margin calls or forced deleveraging, which often amplify downturns in the private sector. However, rising federal debt is not without consequence. Larger deficits can place upward pressure on long-term interest rates, increase debt-servicing costs, and eventually raise legitimate questions about fiscal sustainability. Those adjustments, however, generally unfold gradually rather than through the abrupt contraction in credit that characterized 2001 and 2008.
In our view, the economic outlook remains constructive in the near term. The more challenging question is whether financial markets have already discounted much of this favorable outlook.
MARKETS
Corporate profits remain the foundation of the current bull market. Consensus expects the Standard & Poor’s 500 Index earnings to increase approximately 24% during 2026. While earnings growth has broadened in recent quarters, technology companies continue to account for a disproportionate share of overall profit growth. Strong earnings support hiring, encourage capital investment, and provide income for consumption. For now, the earnings cycle continues to validate the market’s optimism.
History suggests, however, that investors should distinguish between strong earnings and sustainable earnings. During the technology bubble of the late 1990s, the mistake was paying extraordinary multiples for earnings that had yet to materialize. Other market bubbles develop differently. Rather than overestimating the earnings multiple, investors overestimate the durability of the earnings themselves. Peak-cycle profits are mistaken for a new structural level of profitability, making valuations appear deceptively reasonable just before the earnings cycle turns lower.
The central investment question is no longer whether AI will reshape the economy – it almost certainly will. Rather, investors must determine whether today’s extraordinary growth in AI-related spending represents the beginning of a durable increase in normalized earnings or simply another cyclical peak in profitability.
Market leadership reflects this debate. The Standard & Poor’s 500 Index has added approximately $6.2 trillion in market capitalization during the first half of the year, yet 86% of that increase has been generated by only 15 companies directly in AI or, in Caterpillar’s case, in energy infrastructure to support data centers. Narrow leadership is not unusual during periods of technological change, but it does illustrate how heavily investor expectations have become concentrated in a relatively narrow thematic trade.
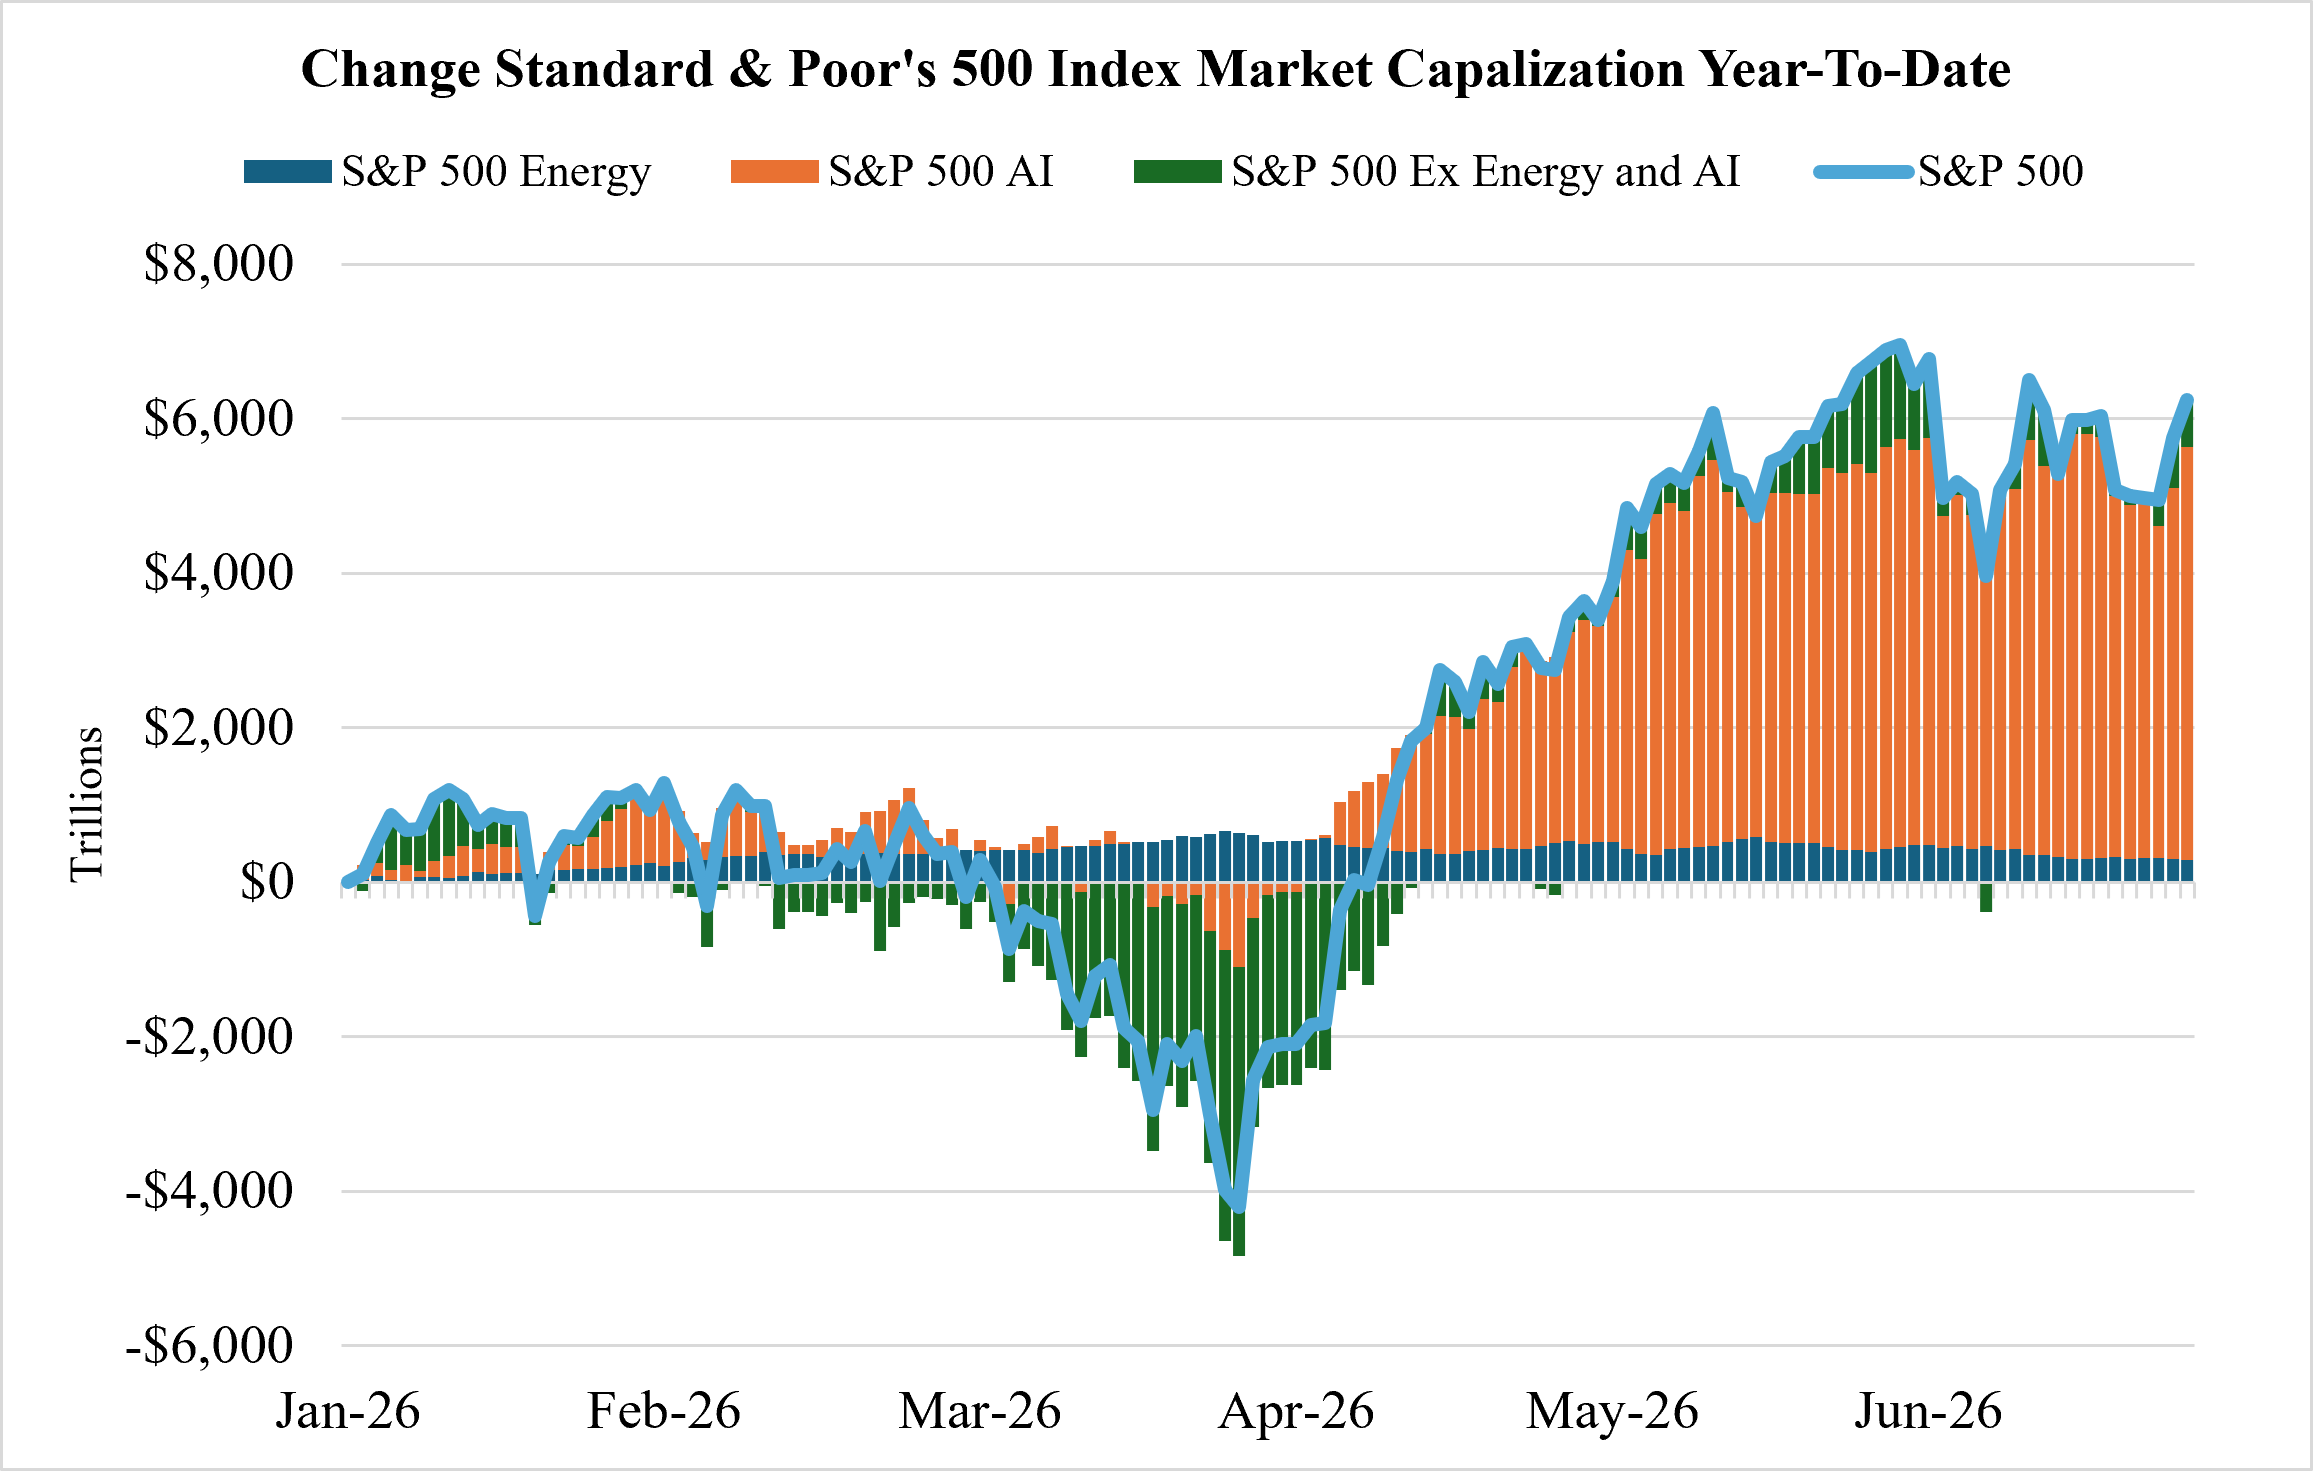
Note: S&P 500 AI consists of the fifteen companies with the largest change in market capitalization during the first two quarters of 2026 (MU, GOOG/GOOGL, AMD, INTC, AAPL, AMAT, LRCX, SNDK, NVDA, KLAC, CAT, DELL, MRVL, PANW, WDC)
Source: Bloomberg
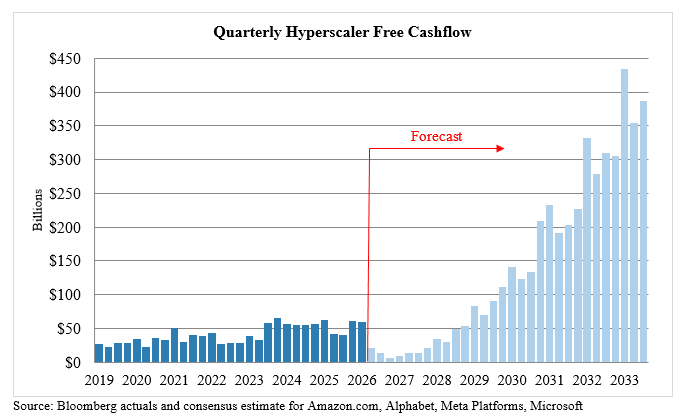
The concentration of returns ultimately reflects an equally extraordinary concentration of capital investment. The companies at the center of the AI buildout – the “hyperscalers”, consisting primarily of Amazon.com, Alphabet, Meta Platforms, and Microsoft – are expected to invest $817 billion in capital during 2027, nearly four times the amount spent only four years earlier. Their spending has become the principal driver of demand for advanced semiconductors, networking equipment, electrical infrastructure, and data centers, creating one of the largest capital-investment cycles in modern corporate history.
The market’s confidence in these companies extends well beyond their current earnings. In 2024, the hyperscalers generated roughly 14% of the Standard & Poor’s 500 Index’s total free cash flow. Wall Street estimates now assume free cash flow growth will compound at nearly 29% annually through 2035, increasing almost sevenfold over the coming decade. By comparison, the remaining 496 companies in the index would do well to compound their free cash flow by 10% annually over the same period. Implicitly, investors are assuming that four companies will capture an increasingly disproportionate share of corporate America’s future cash generation. The chart below compares historical free cash flow generation with the path implied by current Wall Street consensus estimates. Although estimates extending ten years into the future are inherently subject to revision, they illustrate the magnitude of the cash flow growth investors are currently discounting in today’s market prices.
These high cash flow projections carry an expectation of a reasonable return on capital invested, or capital efficiency. Capital efficiency ultimately measures how effectively a company converts investment into future cash generation. Businesses that consistently produce growing revenue and cash flow while requiring relatively modest capital deserve premium valuations because they can compound shareholder value without continually reinvesting every incremental dollar they earn. A good example of this is the Standard & Poor’s 500 Software Index, which compounded at 21.1% annually over the decade leading up to COVID in 2020. In contrast, businesses that must spend heavily to maintain growth eventually face diminishing returns unless those investments generate substantially higher future cash flow. This underscores the importance of forecasted hyperscaler cash flow proving more accurate than not.
Comparisons between today’s AI investment boom and the technology bubble of the late 1990s are inevitable. Both periods have been characterized by extraordinary capital spending, rapidly appreciating equity prices, and widespread conviction that a transformative technology will fundamentally reshape the economy. History, however, suggests that the more important comparison lies not in investor enthusiasm but in how the investment is being financed. In the late 1990s, corporations increasingly relied on debt to finance network infrastructure and telecommunications investments. By the peak of the cycle, businesses were spending well beyond internally generated cash flow, leaving balance sheets vulnerable when growth expectations failed to materialize. A similar dynamic emerged during the housing boom, when excessive household leverage amplified what otherwise might have been a normal economic downturn into a systemic financial crisis. Today’s environment is just beginning to lean more heavily on debt financing, with roughly half of investment-grade issuance year-to-date being AI-related.
A correction in AI-related equities remains entirely possible. Current valuations assume an optimistic path for future productivity, earnings, and return on invested capital. Even so, the economic consequences of a market correction could differ meaningfully from prior busts. Without the excessive private-sector leverage that defines most cycles, declining equity prices would be less likely to trigger a self-reinforcing deleveraging that transformed previous bear markets into deep recessions.
The last two major market dislocations were, at their core, balance-sheet crises. The next one, when it occurs, may instead reflect execution risk. The central question is no longer whether capital is available, but whether the real economy can deliver electricity, infrastructure, supply chains, skilled workers, and ultimately the productivity gain necessary to justify the extraordinary expectation currently embedded in financial markets.
CONCLUSION
The foundation of the U.S. economy has shifted over the past several years. Consumer spending remains an important pillar of growth, supported by a healthy labor market, but business investment has become an increasingly important driver of economic activity. The buildout of AI infrastructure has expanded well beyond the largest technology companies, creating demand across semiconductors, electrical equipment, construction, power generation, and industrial manufacturing. This investment cycle is supporting today’s expansion while laying the groundwork for potentially stronger productivity over the coming decade.
The rapid buildout of AI infrastructure has the potential to transform industries, improve productivity, and redefine competitive advantage across the economy. As a result, investors must determine whether productivity gains and future cash flows ultimately justify one of the largest capital allocation decisions in corporate history. The past reminds us that revolutionary technologies often create enormous benefits for society while generating more modest returns for the companies that build the underlying infrastructure. Ultimately, the challenge is to identify which business will capture the economic value created by AI rather than simply participating in its development.
History also suggests that the market’s greatest disappointments often occur not because investors pay too high a multiple for earnings, but because they overestimate how long extraordinary earnings can persist. Distinguishing between businesses experiencing a temporary surge in profitability and those benefiting from a long-term improvement will be important to preserving shareholder and portfolio values.
FINANCIAL MARKET TOTAL RETURN*
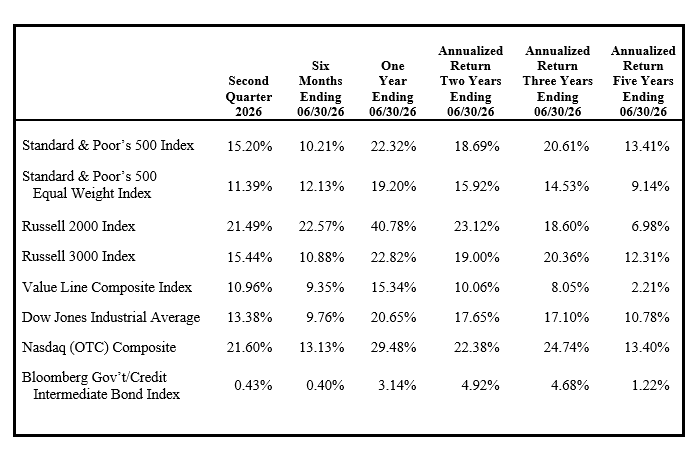
*Total Return Includes Income
Michael C. Yeager, CFA
July 3, 2026
IMPORTANT INFORMATION
The commentary set forth herein represents the views of Luther King Capital Management and its investment professionals at the time indicated and is subject to change without notice. The commentary set forth herein was prepared by Luther King Capital Management based upon information that it believes to be reliable. Luther King Capital Management expressly disclaims any responsibility to update the commentary set forth herein for any events occurring after the date indicated herein or otherwise.
The commentary and other information set forth herein do not constitute an offer to sell, a solicitation to buy, or a recommendation for any security, nor do they constitute investment advice or an offer to provide investment advisory or other services by Luther King Capital Management. The commentary and other information contained herein shall not be construed as financial or investment advice on any matter set forth herein, and Luther King Capital Management expressly disclaims all liability in respect of any actions taken based on the commentary and information set forth herein.